Monitor Sensors
Sensor connection status, the latest reading, and historic readings are available through the hub the sensor is connected to.
1. Go to the Hubs page.
2. Choose a router or gateway. Connection status and latest reading are shown in the list of sensors.
3. To view historic readings, click the Details button next to a sensor in the listing. This will take you to the sensor details.
On the sensor details page, you can view:
- Real time pressure, temperature and battery level
- Graphs of pressure and temperature over time
- Sensor manufacturer information
- Custom metadata
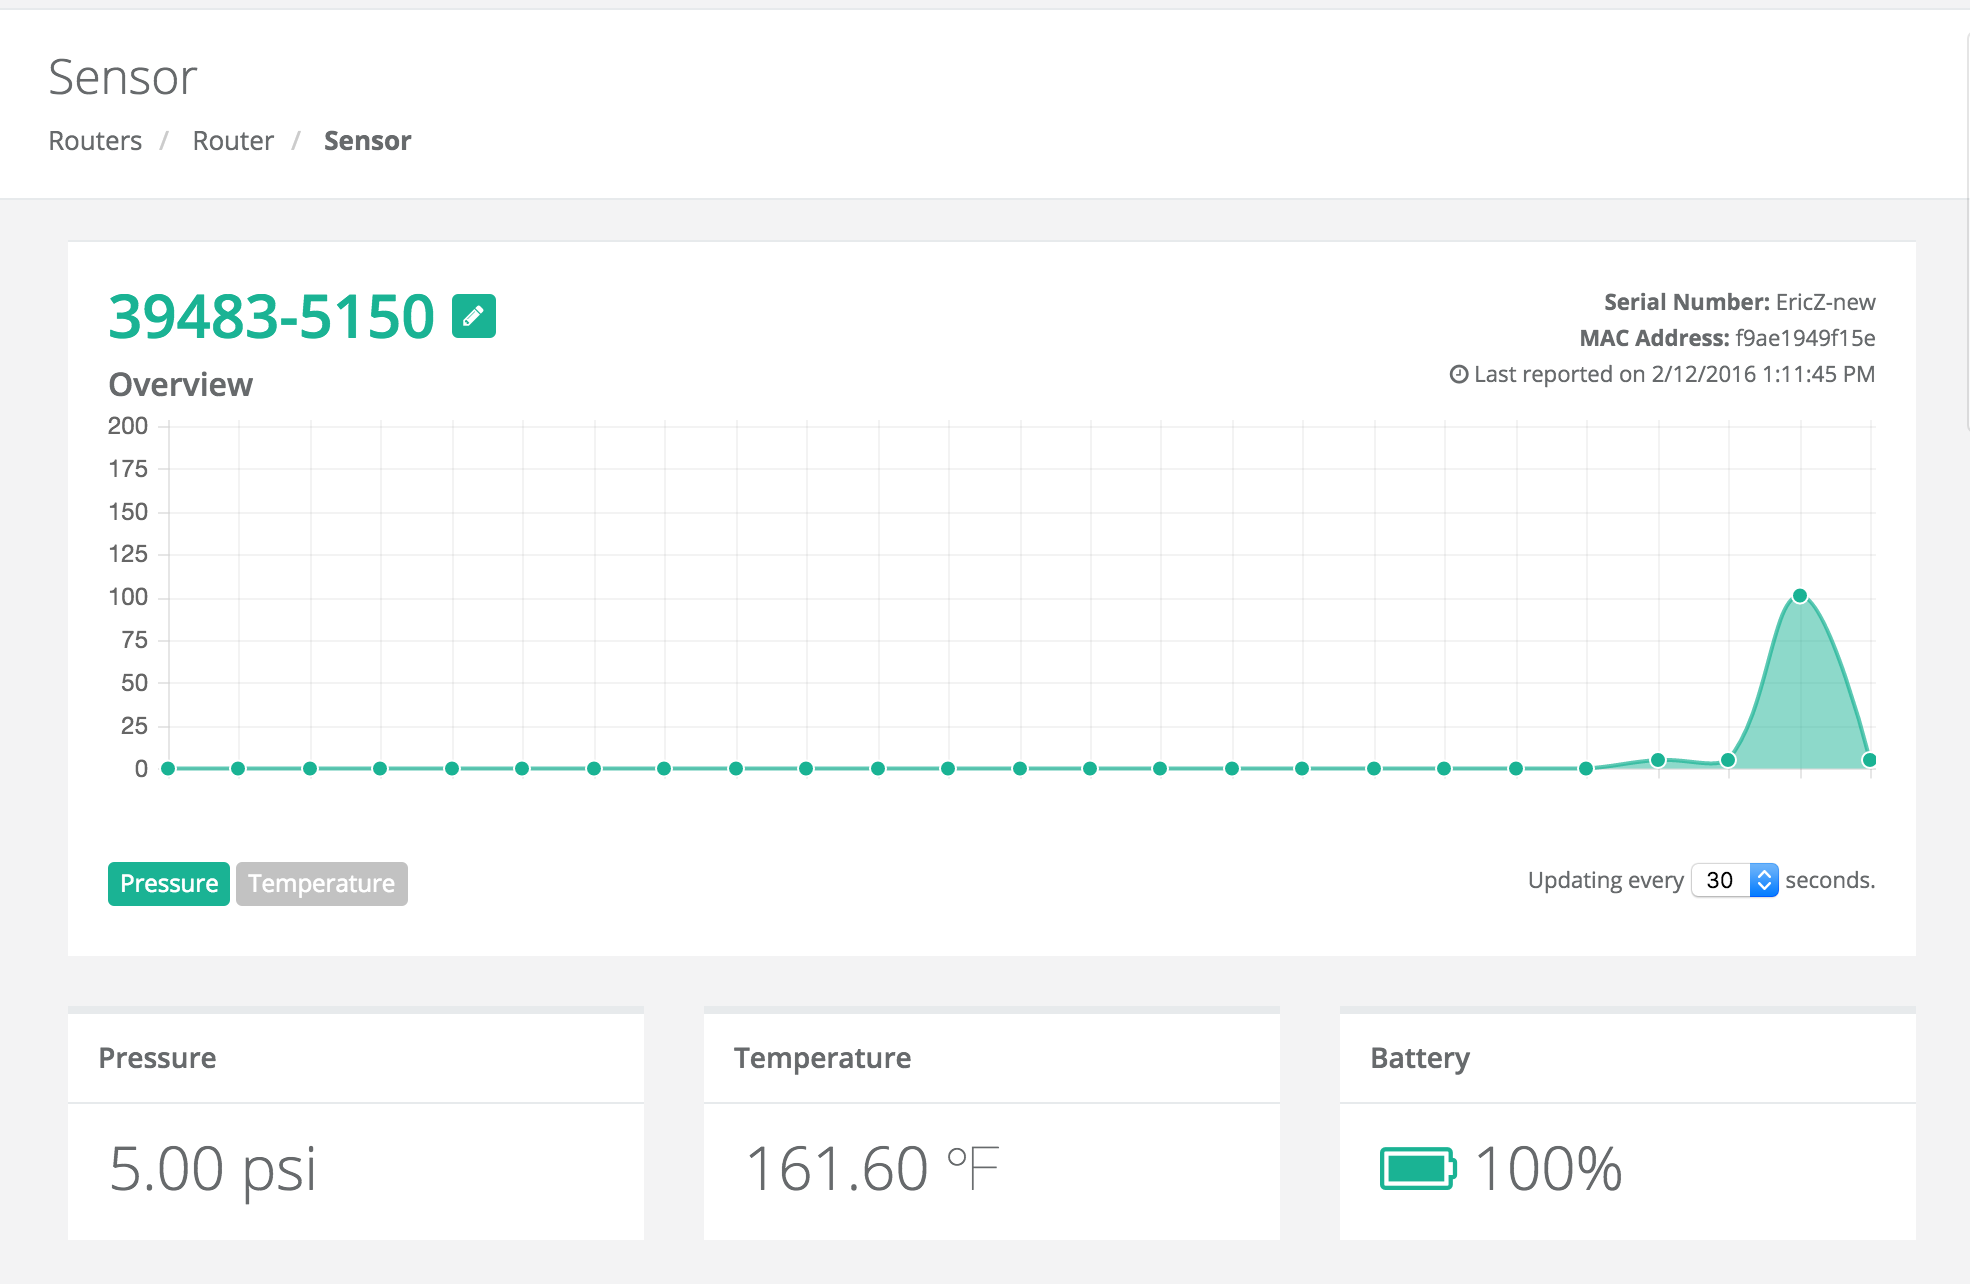
You can use the Pressure and Temperature buttons below the graph to toggle the graph view between pressure and temperature displays. You can also use the drop down menu to configure how often the dashboard should update.